YelpViz
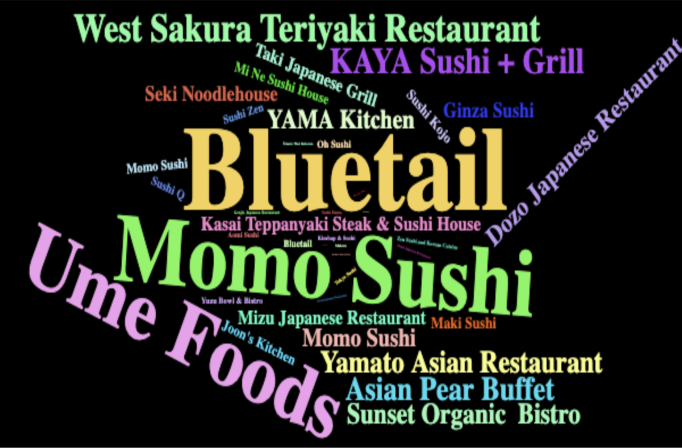
A tool to simplify visualizing business-related data by leveraging Yelp’s API to fetch and analyze business information with interactive charts and geographic heatmaps.
Project Type: Application
Tech Stack:
R
Yelp Fusion API
Plotly
Wordcloud2
ggplot2
Tags:
Data Visualization
Business Analytics
API Integration
R Package
